How Much Dividend Income Can STRC and SATA Generate?
Your purchase price, share count, and dividend assumptions determine the cash income a preferred position could produce. Here’s how to calculate it—and see what changes when you combine positions or assume a lower dividend.

Suppose you buy 100 shares of a preferred stock for $95 each. If each share pays $12 over a full year, your $9,500 position generates $1,200 in cash income. That is a 12.63% yield on your purchase cost.
The arithmetic is simple. The distinction matters: a quoted dividend rate, the dollars you receive, and the yield on what you paid are three different numbers.
The preferred income calculator puts them together for one position or a combination of STRC, SATA, and other preferred stocks. This guide walks through the inputs, the results, and the limits of the estimate.
Start with the dividend assumption
STRC is a Strategy preferred stock; SATA is a Strive preferred stock. Both have variable dividend rates. For the examples below, we use this dated snapshot:
| Preferred | Annual rate assumption | Stated amount used | Modeled annual dividend per share |
|---|---|---|---|
| STRC | 12.00% | $100 | $12.00 |
| SATA | 13.00% | $100 | $13.00 |
Strategy’s September dividend disclosure maintains STRC at 12%. Strive’s declaration for September maintains SATA at 13%. These are annualized rates, not daily or monthly percentage returns. STRC declaration · SATA declaration
The calculator starts with reported rates from our coverage, and you can change them. A current rate is a starting assumption for a model, not a promise about the next twelve months. The saved examples in this guide preserve their stated assumptions even if the calculator’s defaults later change.
All purchase prices below are hypothetical, not market quotes. Every income example assumes a full year of ownership, a constant dividend, and all modeled dividends paid in cash, before taxes and fees.
Dividend rate versus yield on cost
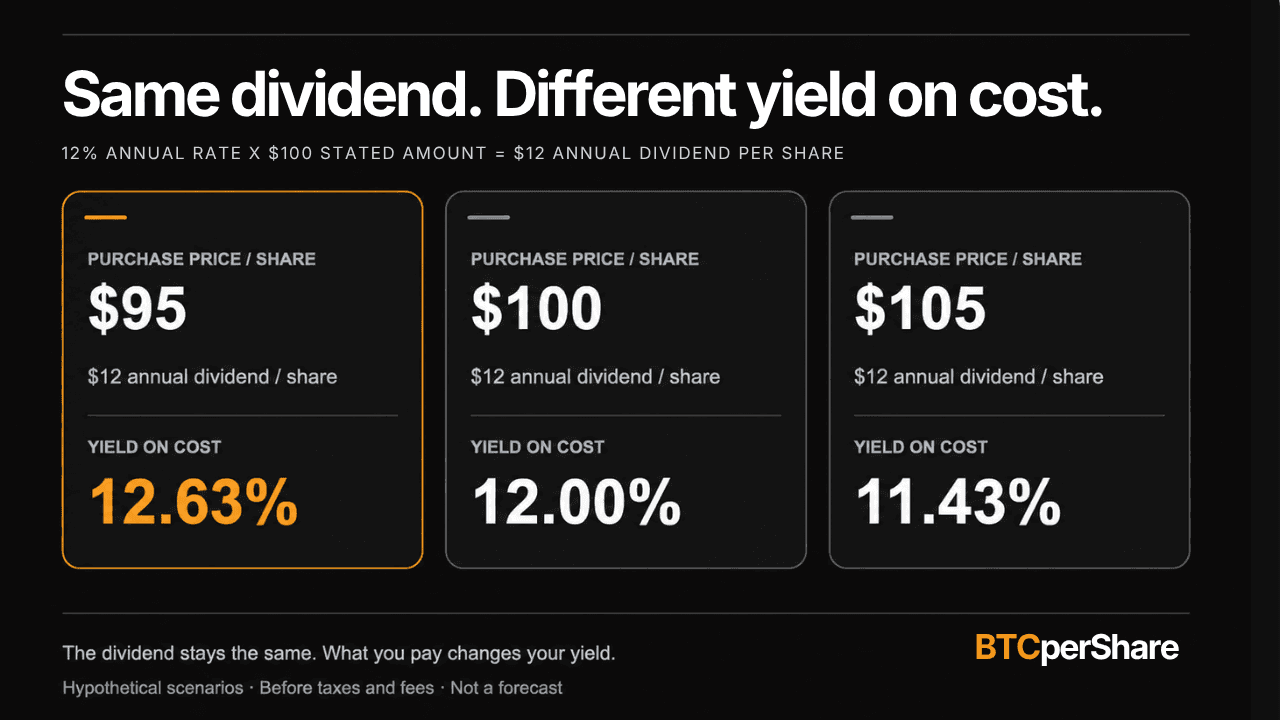
A 12% annual rate applied to a $100 stated amount produces a modeled $12 annual dividend per share:
$100 × 12% = $12 per share per year
Your purchase price determines how much you spend to receive that assumed $12. It does not change the $100 stated amount used in this example.
| Purchase price per share | Shares | Purchase cost | Annual income | Yield on cost |
|---|---|---|---|---|
| $95 | 100 | $9,500 | $1,200 | 12.63% |
| $100 | 100 | $10,000 | $1,200 | 12.00% |
| $105 | 100 | $10,500 | $1,200 | 11.43% |
The formulas are:
- Annual dividend per share = stated amount × annual rate ÷ 100.
- Annual income = shares × annual dividend per share.
- Yield on cost = annual income ÷ purchase cost × 100.
If you already own the position, use your average purchase price to measure income against your original cost. Using today’s market price answers a different question: what income yield would that price imply? This calculator’s purchase cost is not a tax-basis calculation.
Model your first position
Open the STRC example with a $95 purchase price, 100 shares, a $100 stated amount, and a 12% annual dividend assumption. It shows $1,200 estimated annual income, a $100 monthly equivalent, and 12.63% yield on cost.
Open the $9,500 STRC example →
Replace the example price and quantity with your own numbers. Then decide which dividend assumption you want to test. You can enter an annual percentage rate or switch to Annual $ / share and enter the full-year dollar amount directly. Don’t enter one installment as though it were a full year’s dividend.
The tool accepts fractional share quantities for modeling. Whether you can buy or hold a fractional preferred position depends on your broker.
Combine STRC and SATA
You can leave the calculator at one position. If you hold both securities, choose Add preferred position and enter the second holding’s price, quantity, and dividend assumption.
Here is a two-position example:
| Position | Purchase price | Shares | Purchase cost | Annual income | Yield on cost |
|---|---|---|---|---|---|
| STRC at a 12% annual rate | $95 | 100 | $9,500 | $1,200 | 12.63% |
| SATA at a 13% annual rate | $90 | 100 | $9,000 | $1,300 | 14.44% |
| Combined | — | 200 | $18,500 | $2,500 | 13.51% |
Both rate assumptions use a $100 stated amount per share. Combined income is $2,500 a year, or $208.33 a month on average.
The combined yield is $2,500 ÷ $18,500 = 13.51%. It weights the positions by purchase cost; it does not add their yields or take a simple average of the displayed percentages.
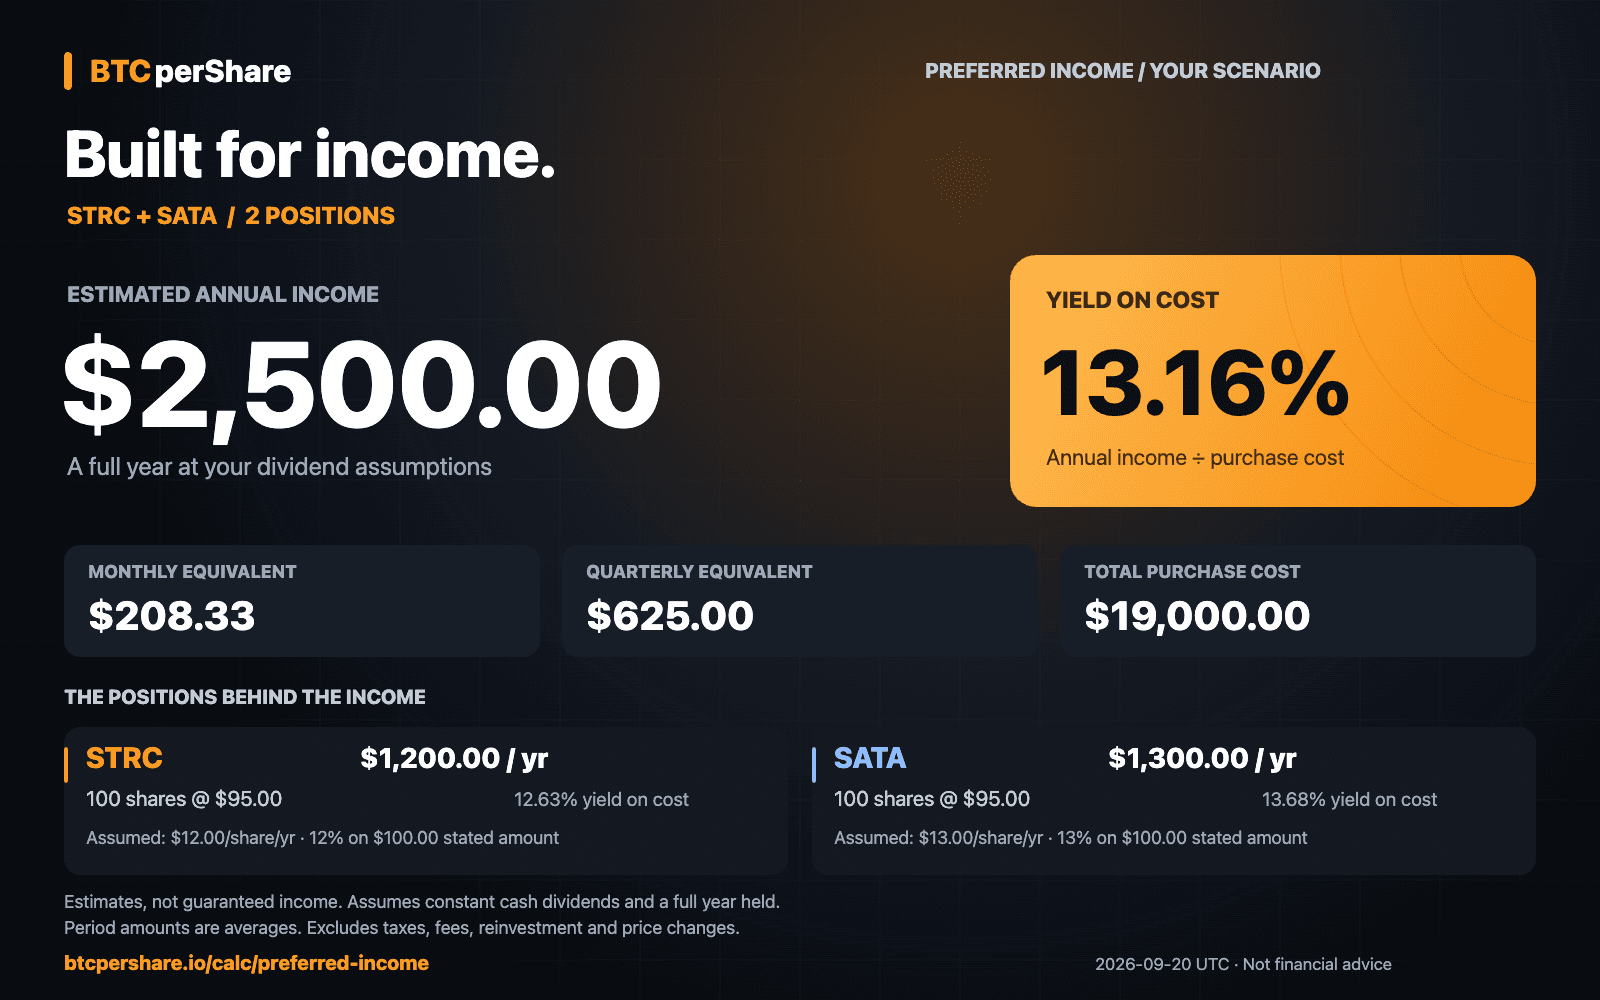
Open the combined STRC and SATA example →
You can also enter separate lots of the same preferred if you bought at different prices. The calculator adds their costs and income to produce the combined result.
Work backward from an income target
An income target makes the numbers more useful. Suppose you want to model $1,000 per month, or $12,000 per year, before taxes and fees.
The starting calculation is:
Required purchase cost = annual income target ÷ assumed yield on cost
At a hypothetical 12% yield on cost, that is $12,000 ÷ 0.12 = $100,000. At 9%, it is about $133,333. At 6%, it is $200,000. These are arithmetic comparisons, not allocation recommendations or retirement withdrawal rates.
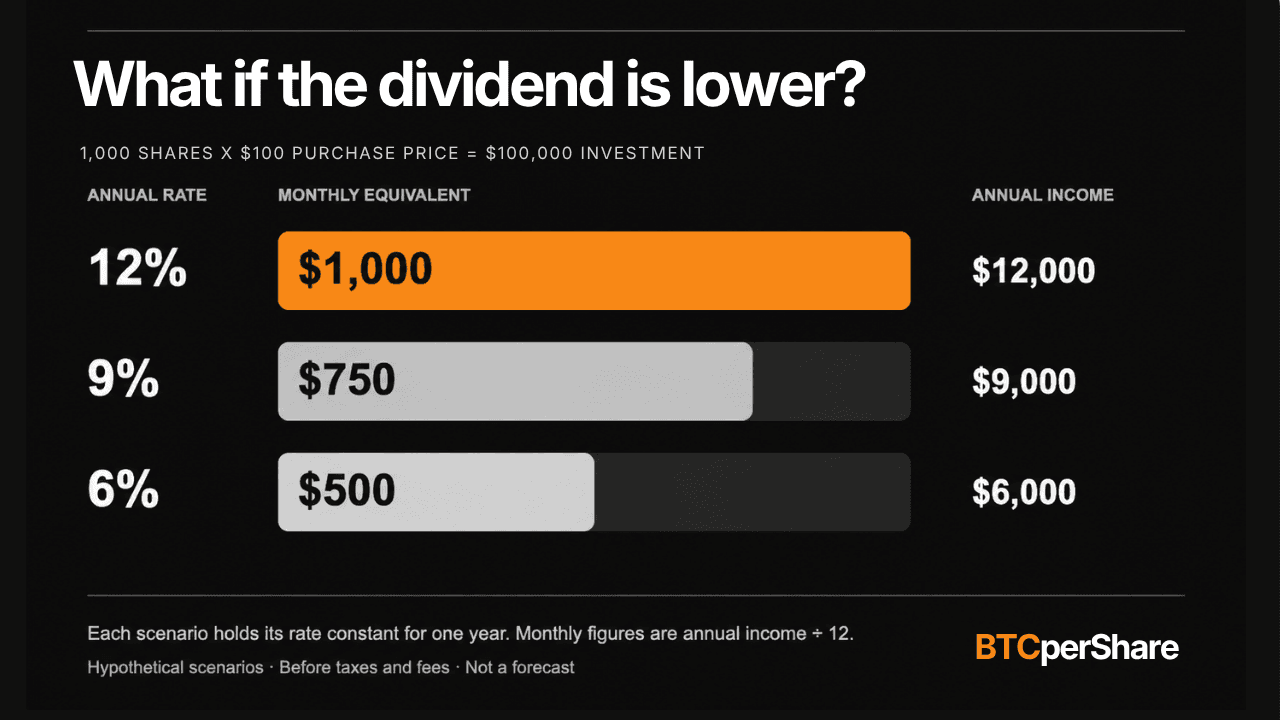
The existing calculator works forward from shares and price. To reproduce the $100,000 example, enter 1,000 shares at $100 each, with a 12% rate on a $100 stated amount. The result is $12,000 annually and a $1,000 monthly equivalent.
Open the $1,000 monthly-equivalent example →
Now keep the position size unchanged and lower the dividend assumption:
| Annual rate assumption | Annual income | Monthly equivalent | Change from 12% case |
|---|---|---|---|
| 12% | $12,000 | $1,000 | — |
| 9% | $9,000 | $750 | −25% |
| 6% | $6,000 | $500 | −50% |
Try the 9% scenario → · Try the 6% scenario →
That gives you a more useful planning question: how much would a lower dividend change the cash available for your expenses? The calculator holds each assumption constant; it does not model the timing of rate changes, missed payments, or later catch-up payments.
A monthly equivalent is not a payment calendar
The calculator divides annual income by twelve to show a monthly equivalent. That helps compare a position with a monthly budget, but it is not a forecast of deposits into your brokerage account.
STRC moved to semi-monthly dividend periods beginning September 16, 2026. SATA’s September declaration lists payments on business days. Actual receipts depend on the applicable declarations, eligibility dates, and your holdings. Use the issuers’ payment schedules when you need dates or exact installment amounts. STRC payment disclosure · SATA September schedule
Cash income and total return can diverge
An income estimate leaves out changes in the security’s market value.
In a hypothetical one-year example, you pay $95 for a share, receive $12 in cash dividends, and sell it for $80. Your cash income yield on cost was 12.63%, but your total result before taxes and fees is:
($80 sale proceeds + $12 dividends − $95 cost) ÷ $95 = −3.16%
That is why the highest displayed income yield does not settle the investment decision. Read each security’s dividend, seniority, redemption, and other terms. A claim on a company is also different from holding Bitcoin directly. Strategy explicitly states that STRC is not collateralized by its Bitcoin holdings and that cash dividends are not guaranteed. Strategy’s STRC information and risk disclosures
Taxes can also change spendable cash. For U.S. federal tax purposes, dividends may receive different treatment; a nondividend return of capital generally reduces tax basis, and amounts beyond a zero basis can create a capital gain. Avoid treating “return of capital” as a blanket promise of tax-free income. This calculator does not calculate taxes. IRS Topic 404
For the issuer side of the story—how preferred financing can fund Bitcoin purchases and create ongoing obligations—read How Preferred Stock Can Finance Bitcoin Purchases. The CEBE calculator adds context on net Bitcoin backing for common shareholders after senior claims; it is not a preferred-stock coverage or safety score.
Save the assumptions with the result
Once you have a useful scenario, choose Save / share PNG to preview the image. On supported devices, Share / Save image opens the device’s sharing options; a PNG download is also available.
Use Copy scenario link when you want someone else to open and adjust the same inputs. The image communicates the result; the link lets readers explore the assumptions. Anyone with the link can see the quantities and prices it contains, so use an illustrative position when sharing publicly if you prefer to keep your holdings private.
For a post on X, the combined example makes a clear starting point: show the annual income and yield on cost, label the numbers as assumptions, and include the matching calculator link.
Where this fits in a broader Bitcoin portfolio
Preferred income is one question within a larger portfolio. For the Bitcoin and common-stock side, the Portfolio BTC exposure calculator combines direct Bitcoin with supported treasury-stock positions and distinguishes gross from net backing. It does not include preferred income or model an entire retirement portfolio.
The Treasury stock vs. Bitcoin calculator explores how Bitcoin price, BTC per share, and valuation assumptions affect a treasury common-stock comparison. It answers a different question from the income calculator.
A retirement framework combining these holdings also needs spending, cash reserves, inflation, taxes, and market-drawdown assumptions. That deserves a separate guide. Here, start by understanding the cash-flow calculation for the preferred position itself.
Frequently asked questions
Is the dividend rate the same as my yield on cost?
Only when your purchase price equals the stated amount used for the rate calculation, under the same annual dividend assumption. A lower purchase price increases the calculated yield on cost; a higher price reduces it.
Can I use just STRC or just SATA?
Yes. Keep one position, or add more to combine securities and purchase lots. All results depend on the assumptions entered.
Will a saved scenario use the newest dividend rate?
No. A saved scenario preserves its dividend assumptions. Review them against the latest issuer information before treating the result as a current estimate.
Does this show what I can safely spend in retirement?
It estimates gross cash income under a fixed set of assumptions. It does not establish a sustainable spending rate or account for changing dividends, investment losses, inflation, or your tax situation.
Put your own assumptions to work: open the preferred income calculator, enter one position, and compare the result with a lower-dividend case. Check the latest coverage for STRC and SATA as you research the underlying securities.
Method: simple annual cash-income arithmetic, with no reinvestment, price gains or losses, fees, taxes, accrued dividends, or partial-year eligibility in the calculator results. The separate total-return example explicitly adds a hypothetical sale price. Rounded figures may differ slightly from unrounded calculations.
Educational information, not personalized investment advice. Published September 20, 2026. Rate snapshot checked September 19, 2026. Saved calculator examples use fixed assumptions.